Example comparison
ELECTRICITY GENERATION BY COUNTRY
Electricity generation is a useful bridge between economy, population and energy infrastructure.
It can reveal countries with very large industrial systems, resource bases or power demand that may not be obvious from land area alone.
What the data reveals
Power-system scale does not follow land area
- People's Republic of China produces about 2.3 times the electricity of United States of America in the published snapshot.
- The five largest systems shown are People's Republic of China, United States of America, India, Russia, Japan. Their ranking reflects total annual output, so population size and industrial demand both influence the pattern.
- Switching from total generation to hydro, nuclear, solar or wind does not merely recolour the same order. Each source metric reveals a different infrastructure and resource geography.
Where annual generation is concentrated
| Rank | Country | Value | Year |
|---|---|---|---|
| 1 | People's Republic of China | 10,162 TWh | 2024 |
| 2 | United States of America | 4,393 TWh | 2024 |
| 3 | India | 2,052 TWh | 2024 |
| 4 | Russia | 1,160 TWh | 2024 |
| 5 | Japan | 907 TWh | 2024 |
| 6 | Brazil | 737 TWh | 2024 |
| 7 | Canada | 611 TWh | 2024 |
| 8 | South Korea | 578 TWh | 2024 |
| 9 | France | 537 TWh | 2024 |
| 10 | Germany | 490 TWh | 2024 |
| 11 | Saudi Arabia | 446 TWh | 2024 |
| 12 | Indonesia | 405 TWh | 2024 |
Total generation is only the first layer
Compare Countries includes total electricity generation and selected generation-source metrics. Total generation is additive and can be compared across groups.
Generation by source can be useful for seeing how different power systems are built: hydroelectric output, nuclear generation, solar generation and wind generation can each produce a different map.
Load the largest generating systems
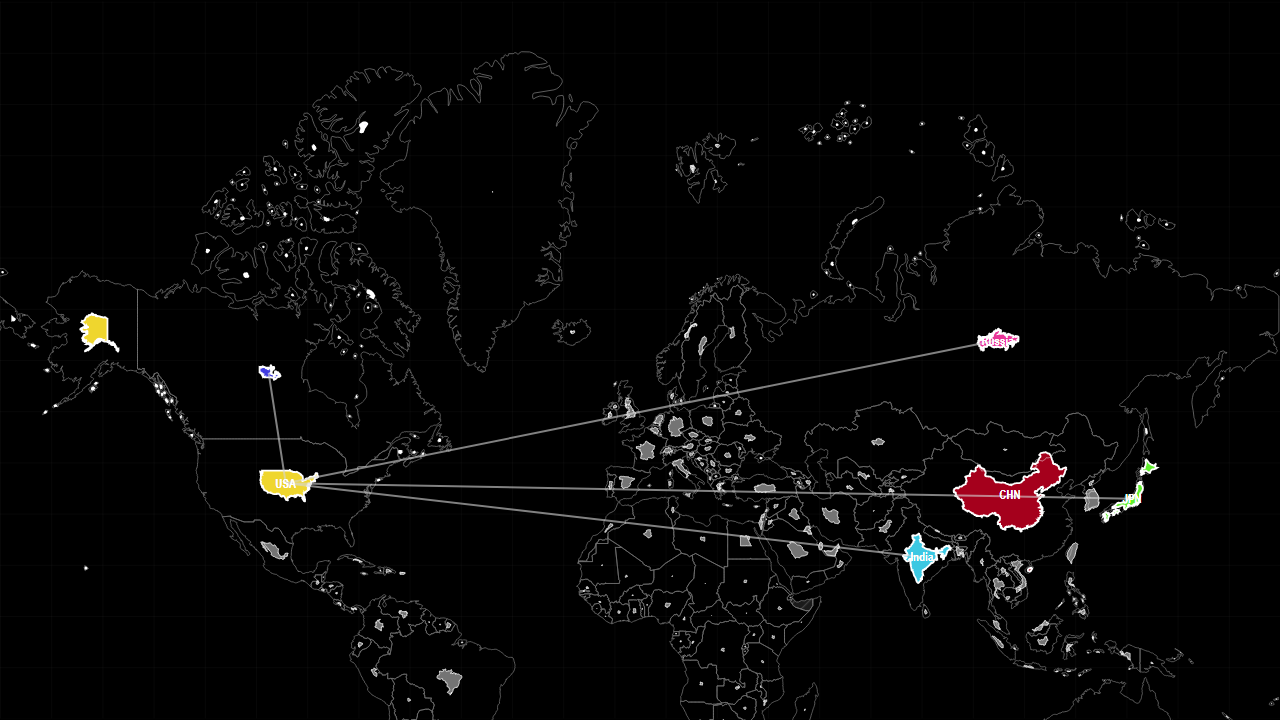
The preset places China against the United States, India, Russia, Japan and Canada on total net generation. Keep the selection and switch among hydro, nuclear, solar and wind to see which systems change position.
Sources used on this page
- International Energy Statistics: International oil, gas and electricity production. Source
Source reference years can differ by metric and by country. The interpretation above was reviewed against the displayed snapshot on 26 September 2026; check the linked source before citing a figure.